v13.0 [Sep 29, 2022]
EViews Interface and Programming:
- Pane and Tab alternative user interface.
- Program Language Debugging.
- Jupyter Notebook Support.
- Program dependency tracking.
Data Handling:
- Daily seasonal adjustment.
- Improved Excel writing engine.
- World Health Organisation connectivity.
- Trading Economics connectivity.
- National statistical bureaus connectivity.
- Holiday function improvements.
- Miscellaneous Improvements.
New Graph, Table and Geomap Features:
- Line and Shade Transparency.
- Custom Data Labels.
- High-low-median Colormap Presets.
- Miscellaneous Improvements.
Econometrics and Statistics:
- Non-linear ARDL Estimation.
- Improved PMG Estimation.
- Difference-in-Difference Estimation.
- Improved VEC Estimation.
- Bayesian Time-varying Coefficient Vector Autoregression.
Testing and Diagnostics:
- Cointegration Testing Enhancements.
- ARDL Diagnostics.
- Pool Mean Group / Panel ARDL Diagnostics.
- Enhanced Impulse Response Display.
v10.0 [May 17, 2017]
EViews Interface
- Automatic and user-controlled workfile and program history, snapshot and backup system.
- Live statistics for spreadsheet views.
- Support for long object names.
- Enhanced logging abilities.
Data Handling
- Improved integration with R.
- Attribute importing and exporting.
- Chow-Lin, Denton and Litterman frequency conversion methods with multiple indicator series.
- Interface to World Bank data.
- Interface to United Nations data.
- Interface to Eurostat data.
- Interface to European Central Bank data.
- Interface to IMF data.
- Interface to Bureau of Labor Statistics (BLS) data.
- Saving to Tableau.
- Saving to JSON.
Graphs, Tables and Spools
- Bubble plots.
- Series updating in graphs.
- New default graph styles.
- Miscellaneous new graph options.
- Table sorting.
- Econometrics and Statistics.
Computation
- Season-trend decomposition (STL).
- MoveReg weekly seasonal adjustment.
- Force annual totals option in X-13
- Special function computation.
Estimation
- Smooth threshold regression (STR).
- Heteroskedasticity consistent robust stardard error options.
- Clustered stardard errors.
- VARs with linear restrictions.
- Structural VAR restriction improvements.
- VAR historical decomposition.
- Improved nonlinear forecasting.
- Additional autoregressive distributed lag (ARDL) tools.
Testing and Diagnostics
- VAR structural residuals.
- Improved VAR serial correlation testing.
- Model bounds checking.
- Model dependency graph.
v9.0 [Mar 27, 2015]
EViews Interface
- Command capture from the interactive interface.
- Dockable command and capture window interface.
- Database and workfile object preview.
Data Handling
- Enhanced import and linking of data.
- A powerful new FRED database interface.
- Direct read and write access to data stored on cloud drive services.
- Dated data table template support for saving and importing customized settings.
- Added frequency conversion methods.
Graphs, Tables and Spools
- Added mixed graph types.
- Graph pan and zoom.
- Multi-graph viewing slideshow.
- Rectangle and ellipse drawing.
- Arrow, rectangle, and ellipse data-based anchoring.
- Tables, graphs, and spools may now be saved in LaTeX format.
Forecasting
- Automatic ARIMA forecasting of a series.
- Forecast evaluation and combination testing.
- Forecast averaging.
- VAR Forecasting.
Estimation
- Autoregressive Distributed Lag regression (ARDL) with automatic lag selection.
- ML and GLS ARMA estimation.
- ARFIMA estimation.
- Pooled mean group estimation of panel data ARDL models.
- Threshold regression.
- Added an optimization engine.
Testing and Diagnostics
- Unit root tests with a structural break.
- Cross-section Dependence Tests.
- Panel Effects Tests.

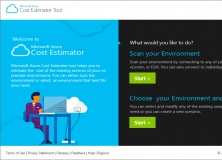
Allows to assess running cost of the existing on-premises workload on Azure.

Determines the potential compression benefit of using the IDS compression.